The Key to the Truth from Alertel V series Platinum automatic Buy Sell and technical analysis software
Volume is the major indicator for the professional trader.
You have to ask yourself why the members of the self-regulated Exchanges around the world like to keep true volume information away from you as far as possible. The reason is because they know how important it is in analyzing a market!
The significance and importance of volume appears little understood by most non-professional traders. Perhaps this is because there is very little information and limited teaching available on this vital part of technical analysis. To use a chart without volume data is similar to buying an automobile without a gasoline tank.
Where volume is dealt with in other forms of technical analysis, it is often viewed in isolation, or averaged in some way across an extended timeframe. Analyzing volume, or price for that matter, is something that cannot be broken down into simple mathematical formulae. This is one of the reasons why there are so many technical indicators – some formulas work best for cyclic markets, some formulas are better for volatile situations, whilst others are better when prices are trending.
Some technical indicators attempt to combine volume and price movements together. This is a better way, but rest assured that this approach has its limitations too, because at times the market will go up on high volume, but can do exactly the same thing on low volume. Prices can suddenly go sideways, or even fall off, on exactly the same volume! So, there are obviously other factors at work.
Price and volume are intimately linked, and the interrelationship is a complex one, which is the reason Alertel V series Platinum automatic Buy Sell and technical analysis software, was developed in the first place. The system is capable of analyzing the markets in real-time (or at the end of the day), and displaying any one of 400 indicators on the screen to show imbalances of supply and demand.
Urban Myths You Should Ignore
There are frequent quotes on supply and demand seen in magazines and newspapers, many of which are unintentionally misleading. Two common ones run along these lines.
- “For every buyer there has to be a seller”
- “All that is needed to make a market is two traders willing to trade at the correct price”
These statements sound so logical and straightforward that you might read them and accept them immediately at face value, without ever thinking about the logical implications! You are left with the impression that the market is a very straightforward affair, like a genuine open auction at Sotheby’s perhaps. However, these are in fact very misleading statements.
Yes, you may be buying today and somebody may be willing to sell to you. However, you might be buying only a small part of large blocks of sell orders that may have been on the market-makers’ books, sitting there, well before you arrived on the scene. These sell orders are stock waiting to be distributed at certain price levels and not lower.
The market will be supported until these sell orders are exercised, which once sold will weaken the market, or even turn it into a bear market.
So, at important points in the market the truth may be that for every share you buy, there may be ten thousand shares to sell at or near the current price level, waiting to be distributed. The market does not work like a balanced weighing scale, where adding a little to one scale tips the other side up and taking some away lets the other side fall. It is not nearly so simple and straightforward.
You frequently hear of large blocks of stock being traded between professionals, bypassing what appears to be the usual routes. My broker, who is supposedly “in the know”, once told me to ignore the very high volume seen in the market that day, because most of the volume was only market-makers trading amongst themselves. These professionals trade to make money and while there may be many reasons for these transactions, whatever is going on, you can be assured one thing: It is not designed for your benefit. You should certainly never ignore any abnormal volume in the market.
In fact, you should also watch closely for volume surges in other markets that are related to that which you are trading. For example, there may be sudden high volume in the options market, or the futures market. Volume is activity! You have to ask yourself, why is the ‘smart money’ active right now?
Volume
Volume is not difficult to understand once the basic principles of supply and demand are understood. This requires you to relate the volume with price action. Volume is the powerhouse of the stock market. Start to understand volume and you will start to trade on facts (not on ‘news’). Your trading will become exciting as you start to realize that you can read the market – a very precious skill that only a few people share.
To say that the market will go up when there is more buying (demand) than selling – and go down when there is more selling (supply) than buying may seem like an obvious statement. However, to understand this statement you need to look at the principles involved. To understand what the volume is saying to you, you have to ask yourself again, “What has the price done on this volume”?
The price spread is the difference between the highest and lowest trading points reached during the timeframe you are looking at, which may be weekly, daily, hourly, or whatever other timeframe you choose.
Volume shows the activity of trading during a specific period. If the volume is taken in isolation it means very little – volume should be looked at in relative terms. Therefore, if you compare today’s volume with volume during the previous thirty days (or bars) it is easy to see if today’s volume is high, low or average compared to the volume seen in the past. If you stand thirty people in a line, it is easy for you to see who the tall ones are, compared to the others. This is a skill of human observation, so you will have no problems identifying whether the volume is relatively high, low or average.
Compare this volume information with the price spread and you will then know how bullish or bearish the professional wholesalers really are. The more practice you have, by taking this professional approach, the better you will become.
To make it easier for you to understand volume, compare it to the accelerator of your automobile. Think about the results you would expect from pressing the accelerator when approaching ‘resistance’, such as a hill. Imagine you are an engineer monitoring a car’s performance by remote control. Your instruments only allow you to see the power applied to the accelerator pedal (volume) and a second engineer is looking at the cars actual motion (price movement). The second engineer informs you that the car is moving forward uphill; however, this uphill movement is not in keeping with your observation of power to the accelerator pedal, which you observe is very low. You would naturally be somewhat skeptical, as you know a car cannot go uphill without sufficient power being applied.
You may conclude that this movement uphill could not possibly be a genuine lasting movement, and that it is probably caused by some reason other than power application. You may even disbelieve what your instruments are telling you, as it is obvious that cars cannot travel uphill unless power is applied to the accelerator pedal. Now you are thinking more like a professional trader!
Many traders are mystified if the same thing happens in the stock market. Remember, any market, just like an automobile, has ‘momentum’ that will cause movement even when the power has been turned off. This example explains why markets can momentarily rise on a low volume up-move. However, all moves with differing types of volume activity can be explained using the “accelerator pedal” analogy.
Why choose Alertel V series Platinum automatic Buy Sell and technical analysis software
We are in the world market for 5 years and have numerous clienteles across the world who is satisfied with our buy sell signal software. Enabled with years of experience with able staff around the world to support your needs plus a robust research and development team makes a mark in your trading world.
The trading strategies in this buy sell signal system is developed by Professionally qualified independent Technical Analyst exclusively for all segment such (Nifty, Bank Nifty, Tata, Reliance, etc Equities, Stocks & Futures) as well as Commodities (like Gold, Silver, Copper, Crude, Zinc, Lead, Nickel, Natural Gas, Aluminum, Oil & Currencies, Dollar, Euro, GBP etc) which in a short time made us India’s best and accurate trading signal system for both intraday and positional trading. We plan to be the most reliable source of trading signal provider in the world and we know we cannot realize this dream by giving bad signals, and by the way according to other sources we are currently one of the number one buy sell signal providers for FOREX and Indian markets.
Alertel buy sell signal system offers Live Charts with Auto Buy Sell Signals, Text and Voice Alerts for Intraday Trading in MCX Commodity, Nifty Stocks, Nifty & Bank Nifty Future, NSE Stock Futures, Nifty Put Call Options, NSE Currency Forex and NSE 100 Stocks for Positional Trading with Charts & Alerts.
Be it intraday trade or position trade Alertel V series buy sell signal software provides more than 95% accurate buy sell signals for both forex and Indian stock market like MCX , MCX SX , NSE and nifty stocks, making it the ultimate buy sell signal software in the world.
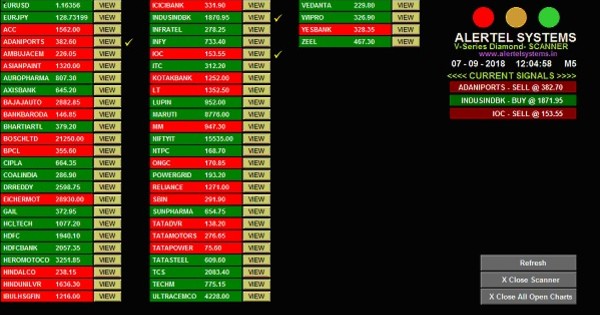
How Alertel V series platinum buy sell signal system is the best buy sell signal software in India and how it affects my trading?
Well Pictures speak more words than actual words. Before I show you yesterdays snapshots let me explain briefly about the company. Xentel’s Alertel buy sell signal system provides you the near perfect accurate buy sell signals for –
- NSE Stocks and Futures include NIFTY, BANK NIFTY, INFOSYS, SBIN, etc.
- Commodities in MCX and NCDEX (COPPER, CRUED, SILVER, GOLD, NICKEL, NATURAL GAS, etc)
- Currencies in FOREX and MCX SX (EURUSD, JPYUSD, USDINR, EURINR, JPYINR, etc)
We all know we want to make money and we want to make it quick. This is what exactly we offer. We have done the research for you. We have done the analysis for you. We have done the math for you. You need to spend hours listening to market gibberish or some guy yapping away on the screen or spend head breaking hours studying the market and going through journals.
Alertel buy sell signal software does the above all and gives you the most accurate buy sell signals for you to trade like a professional from day one itself.
Its four level confirmation system lets you know the validity of the signal generated so you can be sure that the buy sell signal generated is 100 percent authentic. This made us the best buy sell software for NIFTY trading along with MCX and FOREX in India and around the world.
Alertel V series platinum is the Most Successful Buy Sell Signal Software in India for MCX, NSE, FOREX and COMEX market, and now it comes with three trading systems under one pack. Each trading systems gives buy sell signals with more accuracy and assured monthly return. All trading systems comes with Buy Sell Alert with Popup message and sound.
Features:
- Equipped with Four Level Filtering system to assure for highest accuracy signals
- Thoroughly Tested by Professional Traders in EUROPE and now released in INDIA.
- Alertel V series platinum suitable for any markets such as FOREX, MCX, NSE (Stocks & Futures), MCX SX, NCDEX, SPOT (Gold & Silver), etc.
- Alertel V series platinum is suitable for both day traders as well as positional traders.
- Three Target Levels will be printed on screen, so that traders will get clear idea where to book the profit.
- Stop Loss levels are printed on screen, Alertel V series platinum is equipped with Trailing Stop Loss, so this stop loss will change according to the market movements, so that traders can minimize the RISK.
- Easy To Understand with Detailed Tutorial and Video Presentation
- No Prior experience needed
Experience it for free.
www.alertelsystems.in
www.alertelsystems.com
Some good reads
- The one thing new traders need for daytrading
- An open letter from Conrad Dagobert – CEO of Alertel Systems
- How to make money quick
- Total Freedom for you
- The Best scalping software in the world
- How can a student invest in stock market
- Choose your trading style
- How to Invest and trade in stock market using Alertel V series Platinum Buy Sell Signal Software
- Advantages of Metatrader 4 (MT4) and Alertel buy sell signal software for MCX, NSE and FOREX
- Online currency trading (Forex) – Advantages and How to make profits
- How to trade MCX and NSE
- The K.I.S trading style from the world’s best daytrading buy sell signal and support system
- Why is Alertel the World’s best automatic buy sell signal software
- Why do most traders fail in trading?
- Trader’s health tips from the best buy sell signal software and support system
- 10 Reasons why you should start trading
- An open letter to you from Alertel daytrading support buy sell signal ssytems
- 36 Awesome features of Alertel Buy Sell Signal Software
- Three rules to follow to be rich if you are using Alertel buy sell signal software
- Top 5 cool things you can so with Alertel buy sell signal system for FOREX, MCX and NSE
- How to make money in stock market by daytrading
- How to make 50% of your investment as profit in just 30 days of daytrading