When a trader starts his trading carrier he will likely to be met with a pool of different methods. Most of the trading opportunities can be easily identified by knowing just one of four chart indicators. The four chart indicators are Moving Average, RSI, Stochastic, and MACD indicator. Traders often over-complicated things by adopting a complex trading strategy. It is always better to see things as simple as possible. But making things complicated is an unfortunate fact. However, the reality is that traders will lately conclude that trading with simple strategy is often best. So give value to your time. Don’t be so late, begin with a simple trading strategy and stick on it.
One simple trading plan includes chart indicators and some rules as to how you should use those indicators. Simple is best, Out of four easy indicators better understanding of two will easily guide you the trading entry and exit points. You will be your best ally once you commence trading with simple plan with simple rule. When you opt chart analysis to simply identify the trading opportunities you can see two common market environments. One is ranging market and the other is ceiling market. Ranging market has strong level of support and resistance level. But in ceiling market price isn’t breaking through. Another type of market is trending market where price moves steadily higher or lower.
Technical Analysis found out higher probability entry and exit by reading indicators. Indicator reading is simpler than putting them on the chart. Therefore, technical analysis can easily identify range bound and trending market. Now let’s discuss some indicators by using which you can easily identify better trading opportunities.
Moving Average indicator
During up trend market moving average can be used to identify the trend and the right time to buy or sell. The moving average is measured as the average closing price of a stock over the last “x” periods. Like the last 200 days or year of price action. In this way you can understand the trend of the market. There are infinite numbers of moving averages. This indicator is probably one of the most basic forms of technical analysis. Save your time by using moving average to determine the strength of the move.
50 and 200 day moving average is most popular among the traders. Simple moving average cross over strategy can be adapted. Commonly used moving averages are 10 and 20 or 50 and 200. Consider 50 and 200 day moving average. When 50 day moving average crosses above 200 day moving average it creates a golden cross. In contrast, when 50 day moving average crosses beneath 200 day moving average it generates a death cross. You can buy the stock during the golden cross and you can sell the stock during the death cross. When the currency pair moves in the direction of moving average it is the entry point similarly when it begins to move opposite it is the exit point.
Relative Strength Index (RSI)
This is a simple and helpful oscillator. This oscillator is helpful for those who expect huge profit. One who wishes to buy at low and sell at high RSI may be a right indicator. RSI works well in both trending and ranging market. Better entry and exit prices can be located easily. RSI helps to determine the trend, time entries and more. However, RSI is a momentum oscillator, extended trends will keep RSI overbought or oversold for long periods of time.
This oscillator is plotted with values between 0 and 100. Here the value 100 is considered overbought and 0 value is considered oversold. Like all other oscillator RSI also have center line. Found in the middle range at a reading of 50. Technical traders often use this center line to show change in the trend. Above 50 RSI indicate momentum is up. At this condition traders can look for opportunities to buy the market. Traders can sell the market if RSI is below 50, because momentum is considered down at this time. A rise above 50 would indicate growth of a new bullish market and drop below 50 would indicate the enhancement of a new bearish market. If an uptrend has been discovered, you need to check is whether the RSI is reversing from readings below 30 or oversold.
Slow Stochastics
Slow Stochastics is also an oscillator like the RSI oscillator to locate overbought or oversold environments. Basically, it is a price oscillator that compares a security’s closing price over ‘n’ range. 14 is the most commonly used range for Slow Stochastic indicator. This can be calculated on any time frame. The Slow Stochastic indicator ranges from 0 to 100. It is a great indicator for identifying the primary trend. You will be able to uncover some hidden trading opportunities in the market if you combine some basic technical analysis methods such as trend lines.
Traders will often buy when the slow stochastics drop below 20 and exit when slow stochastics crosses over 80. %K and %D are the two lines to signal our entry into market while using Slow Stochastic oscillator. But the problem with this methodology is that even though the stock is over 80, it should not be looked upon as overbought, but rather as trending strongly. Similarly if the stock is under 20, it is a sign of weakness but without any support the stock will likely continue lower.
Moving Average Convergence & Divergence (MACD)
Moving Average Convergence and Divergence is also known as the king of oscillators. This can be used well in trending or ranging market since it use moving average and provide a visual display of changes in momentum. It is a redefined version of the two moving average system. It develop as a leading momentum oscillator by combining the moving average, traditionally lagging, trend-following indicator and another moving average. MACD values are dynamically plotted above and below a zero center line, So it generates clear and actionable signals as an oscillator.
After filtering out the ranging or trending market in order to derive signals from this indicator two things are need to be considered. One is realization of the lines in relation to the zero line. Next is identification of a crossover or cross under of the MACD line to the signal line. If the red line crossover the blue line it is an indication for a buy and if the red line cross under the blue line it is an indication for a sell. Similar to other indicators, the MACD is best coupled with an identified trend or range-bound market. Even though this tool is incredibly popular and highly trusted it had some limitations also. Limitations include MACD’s sensitivity and proclivity toward whipsaws.
By the better understanding of any of two indicators among these four indicators will help you well for a successful trading. If you get a software which include all these indicators will be a best support for you.
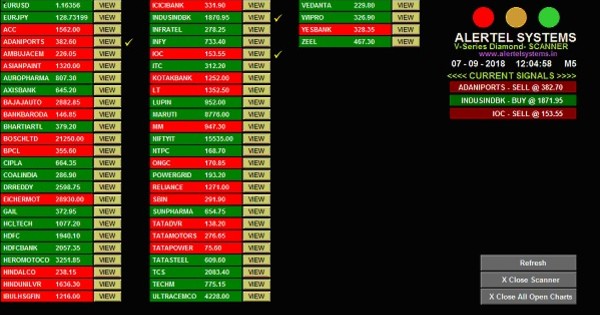
- Top 5 cool things you can so with Alertel buy sell signal system for FOREX, MCX and NSE
- How to make 50% of your investment as profit in just 30 days of daytrading
- Why is Alertel the World’s best automatic buy sell signal software
- An open letter from Conrad Dagobert – CEO of Alertel Systems